How is the competition increasing at the UTMB® Finals?
By Doug Stewart, Performance Director
Every year, I do a deep dive into some stats linked to trail running. In the past I have explored the evolution of the UTMB Index and how the scores are changing, and also the trend of finishing times of all runners at UTMB. This year, I am focusing on the UTMB ® finals (OCC, CCC and UTMB) – looking to see the trends in the top finishers across these three races. Across the three distances, there are some commonalities, but also some interesting variances that help illustrate how things are changing at the front of the pack of the most competitive events.
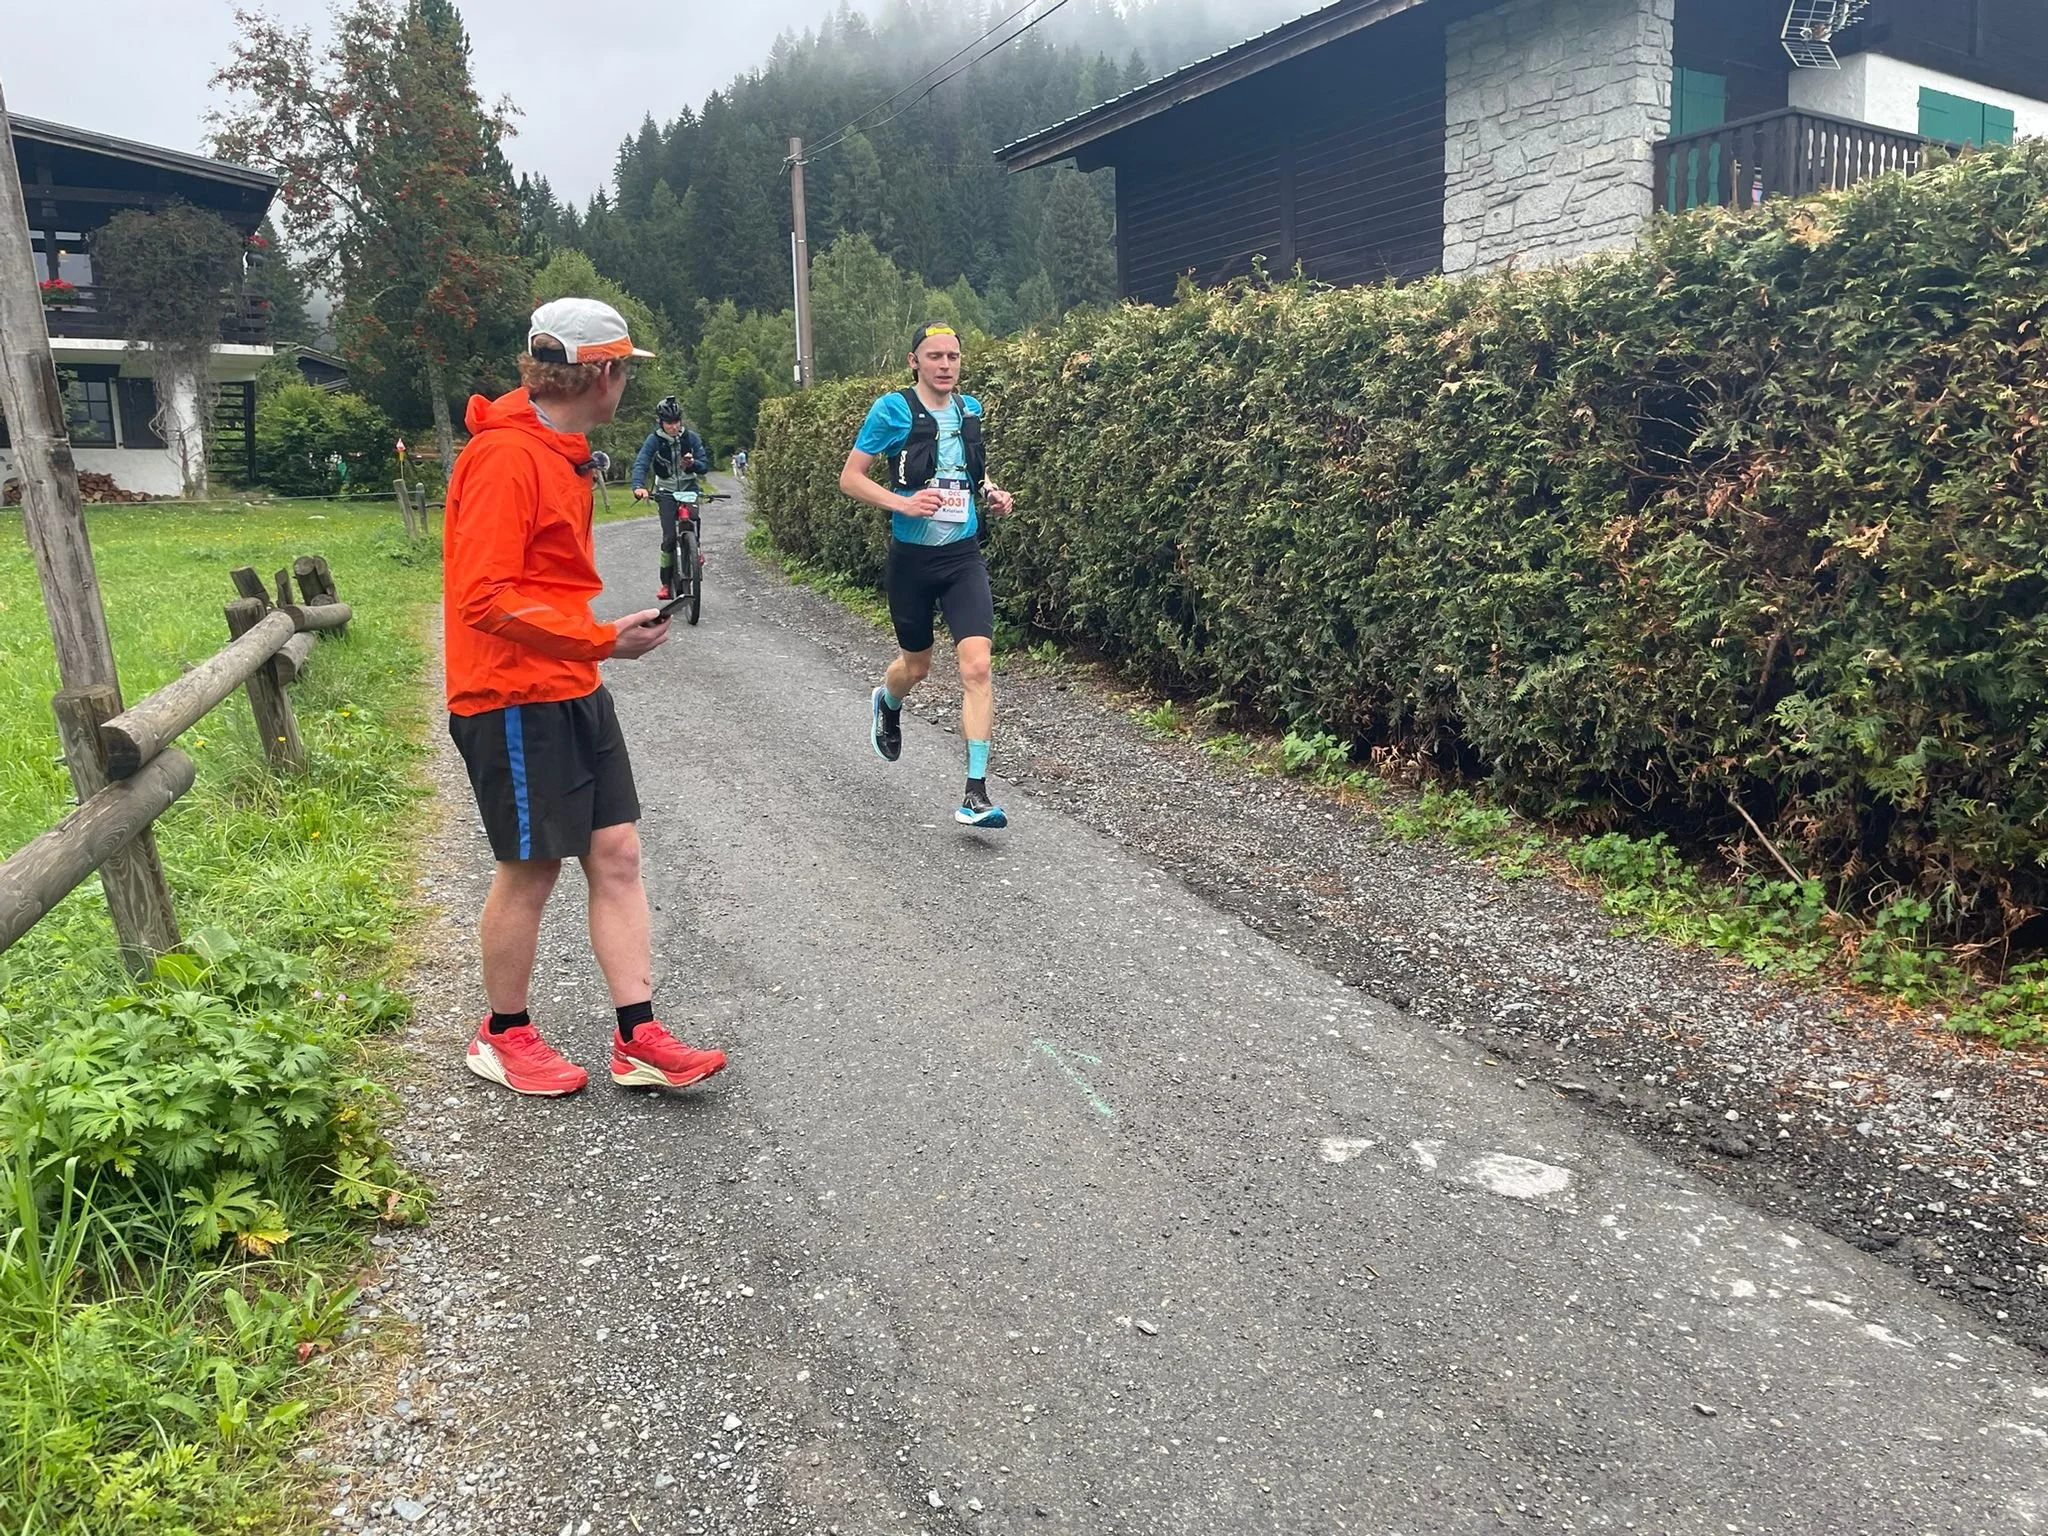
Cheering on Kris at the UTMB OCC 2025
OCC Trends
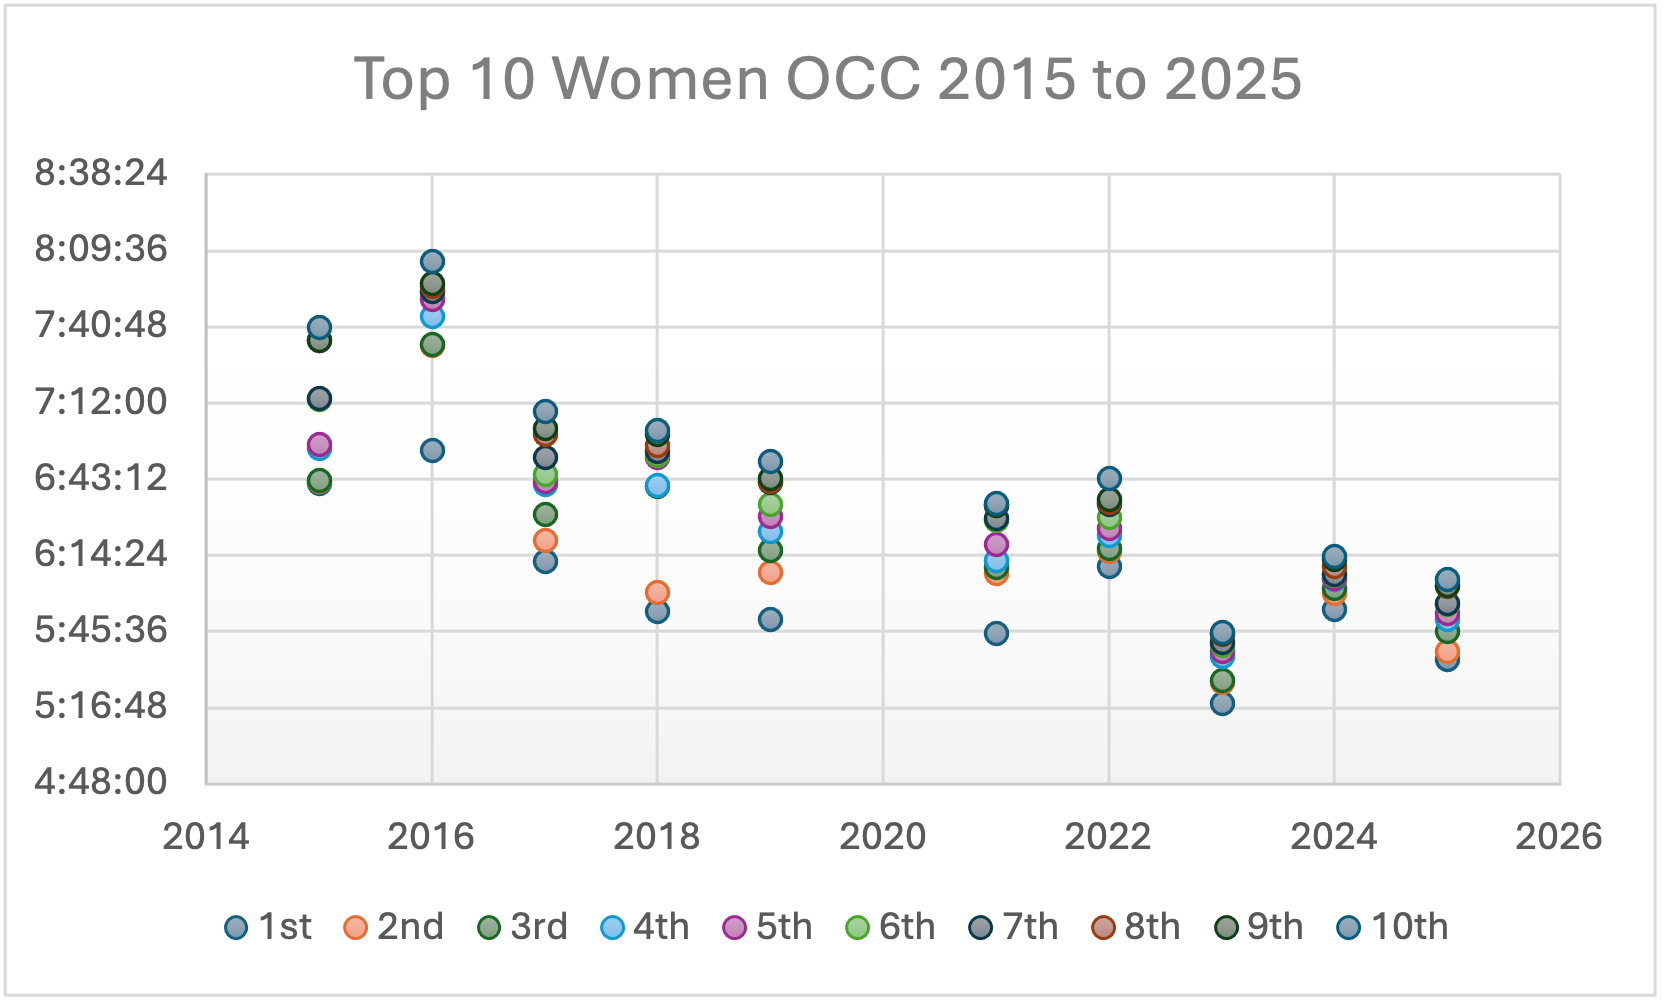
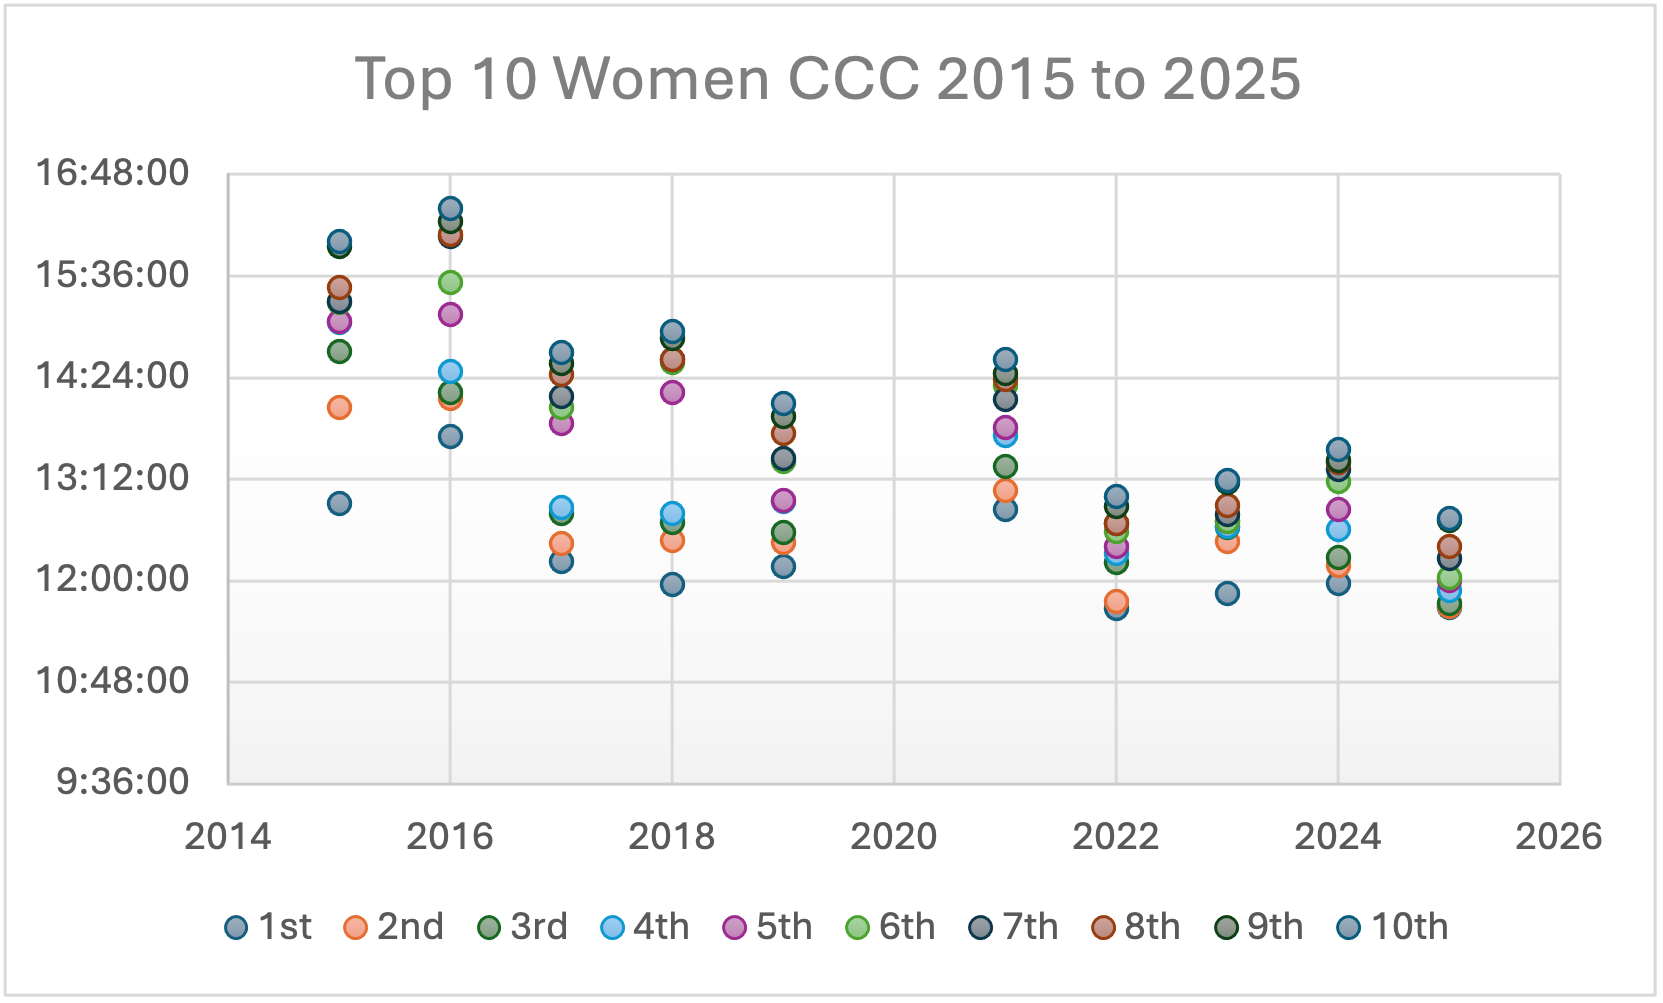
It is important to note that in certain years the course has been changed (such as in 2025, because of bad weather), so a comparison between years is not a direct like with like. However, we can still see a clear downward trend in the finish times of the top 10 women competing in the OCC. Another clear trend is the grouping of the top 10, with the past 4 editions being the 4 closest among all the years reviewed. In fact, 2024 showed a particularly tight top 10 in the women’s race.
For the male OCC Top 10, the data is a little more mixed.
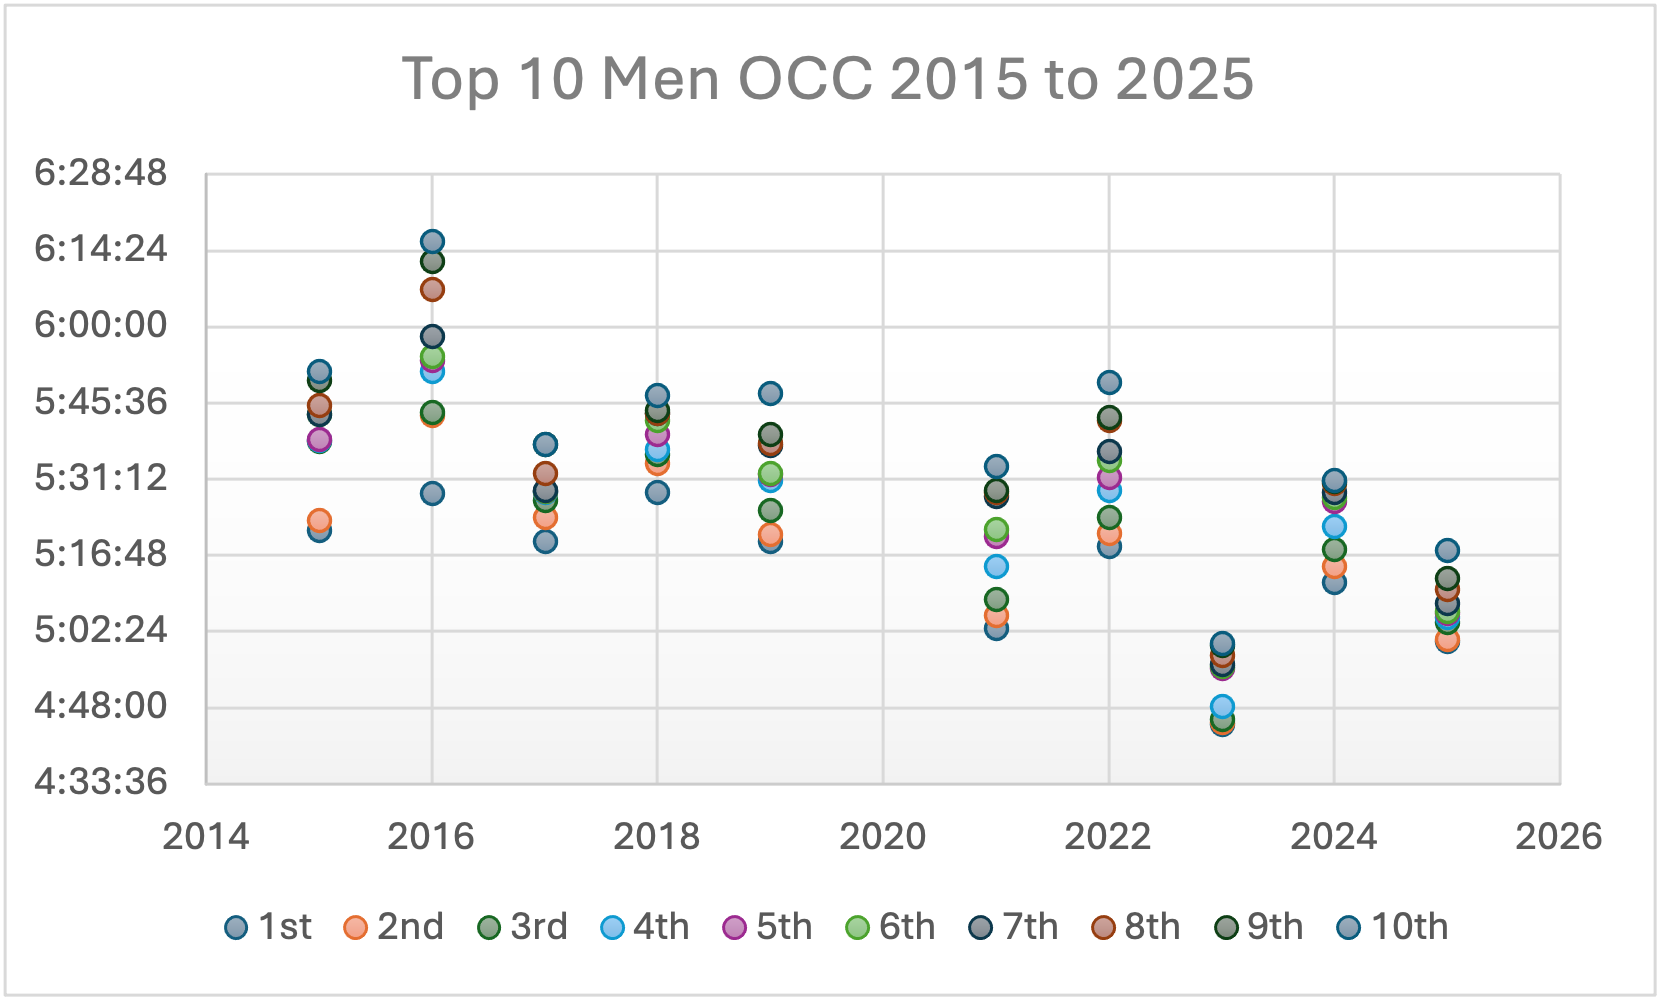
Note, the y-axis vertical scale is different between the men’s and women’s charts, reflecting each group’s final finishing times.
Whilst there is a slight downward trend in the men’s finish times, and the 2023, 2024 and 2025 editions all had a close Top 10, 2017 and 2018 were also very close amongst the top 10 runners.
However, it is worth noting that the 2025 men’s race had the closest ever top 5 and top 25 finishes as a percentage of the winner’s time.
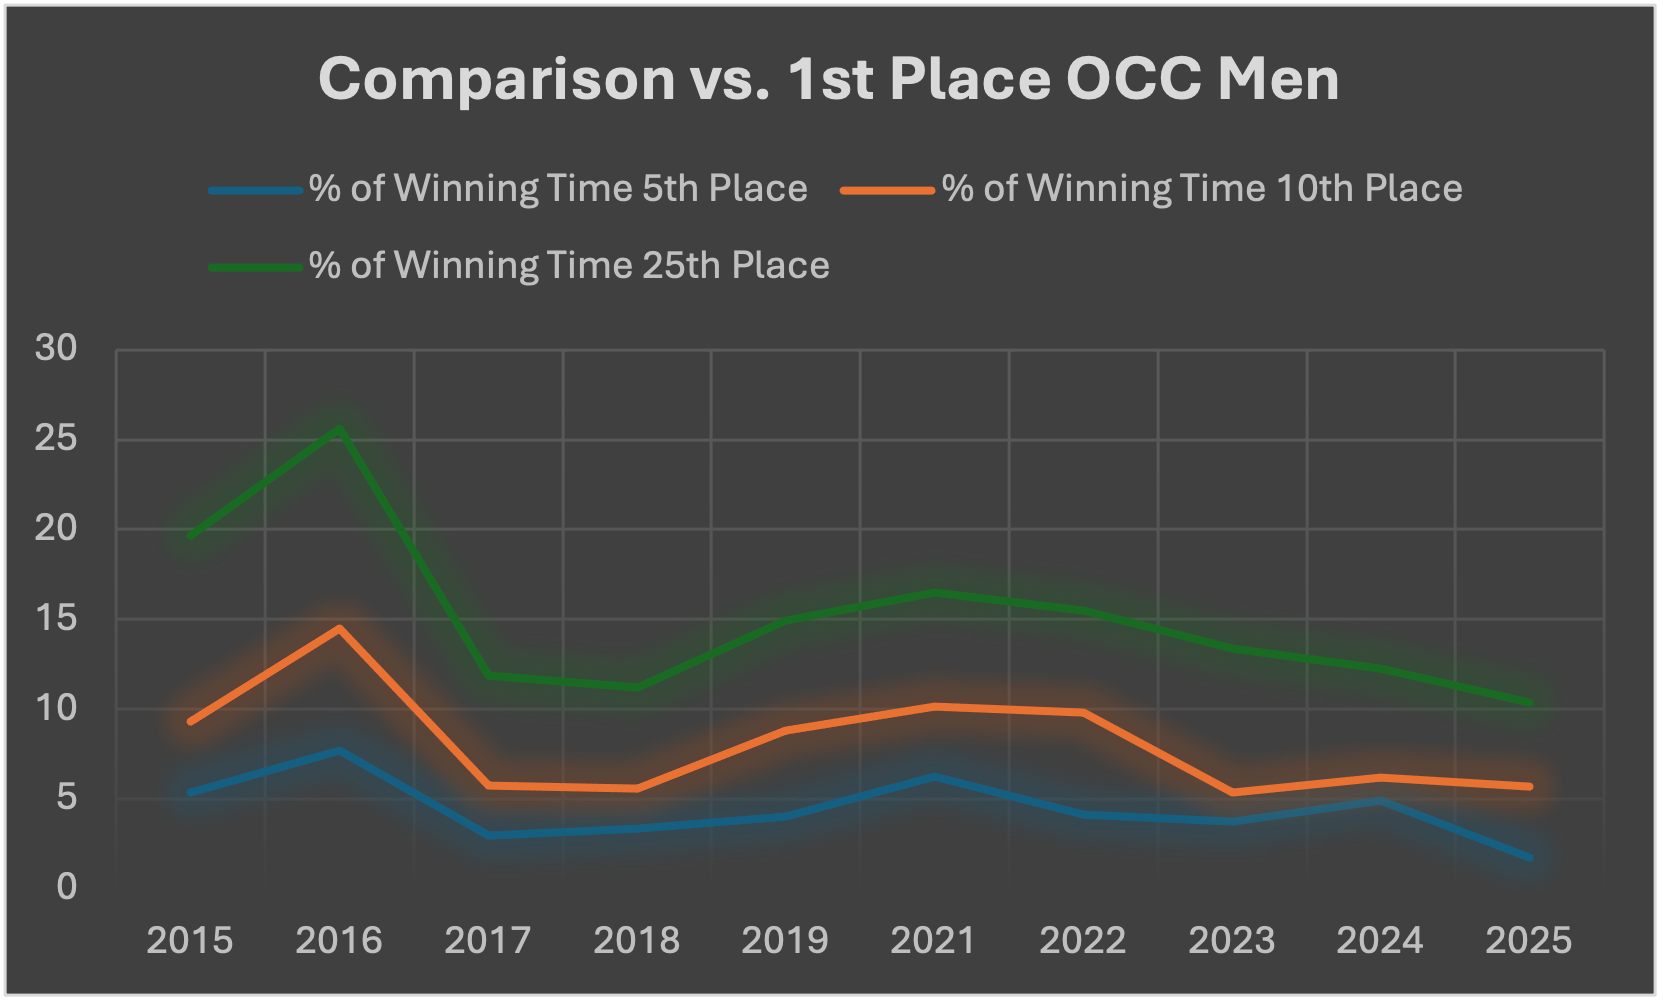
5th place was only 1.75% slower than Jim Walmsley’s winning time in 2025, and 25th place was 10.4% slower.
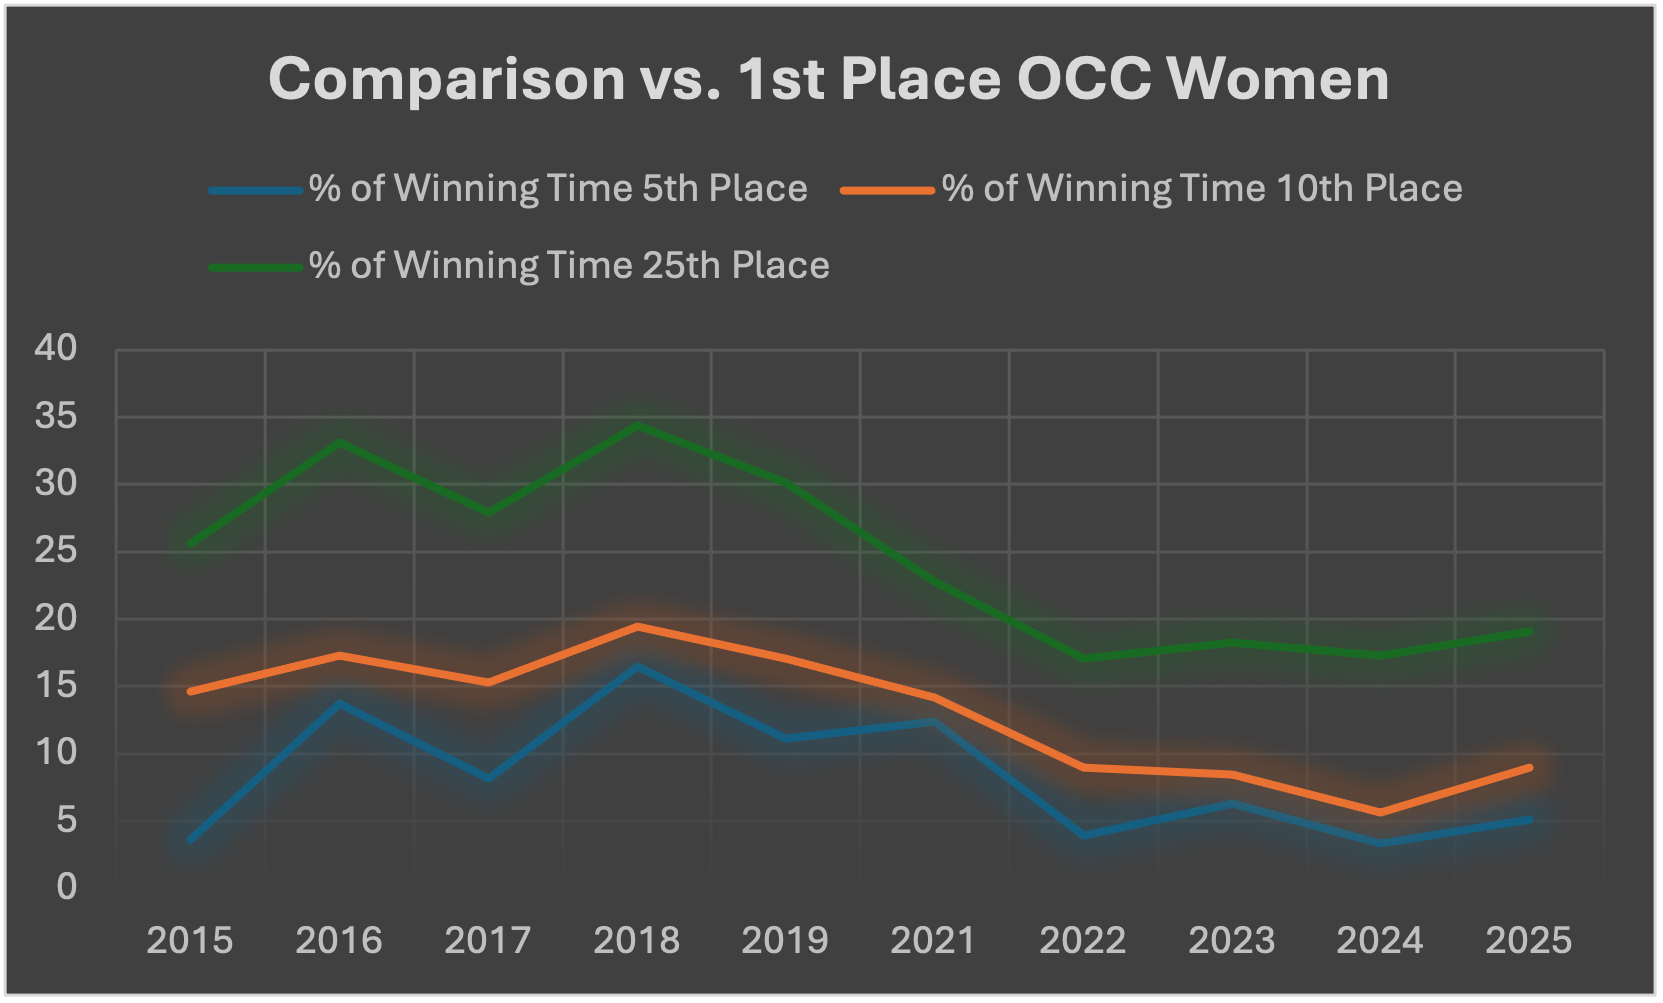
Comparing 5th, 10th and 25th as a percentage of the winner’s time in the women’s race also shows a clear downward trend for the years studied. Whilst not yet as close together as their male counterparts (note the range on the Y-Axis), there have been some examples, highlighted below, where the finish times are actually closer in the women’s race.
This is great for the sport, as it shows us that the standard of competition is improving in the women’s and men’s races, and that races are getting tighter and more exciting overall. Among all the events I looked at, the closest top 5 finish for the men was OCC 2025, whilst for the women it was CCC 2025 – both the most recent editions of the respective races.
Training for the OCC? We have dedicated training plans you can download and use directly through TrainingPeaks:
CCC Trends
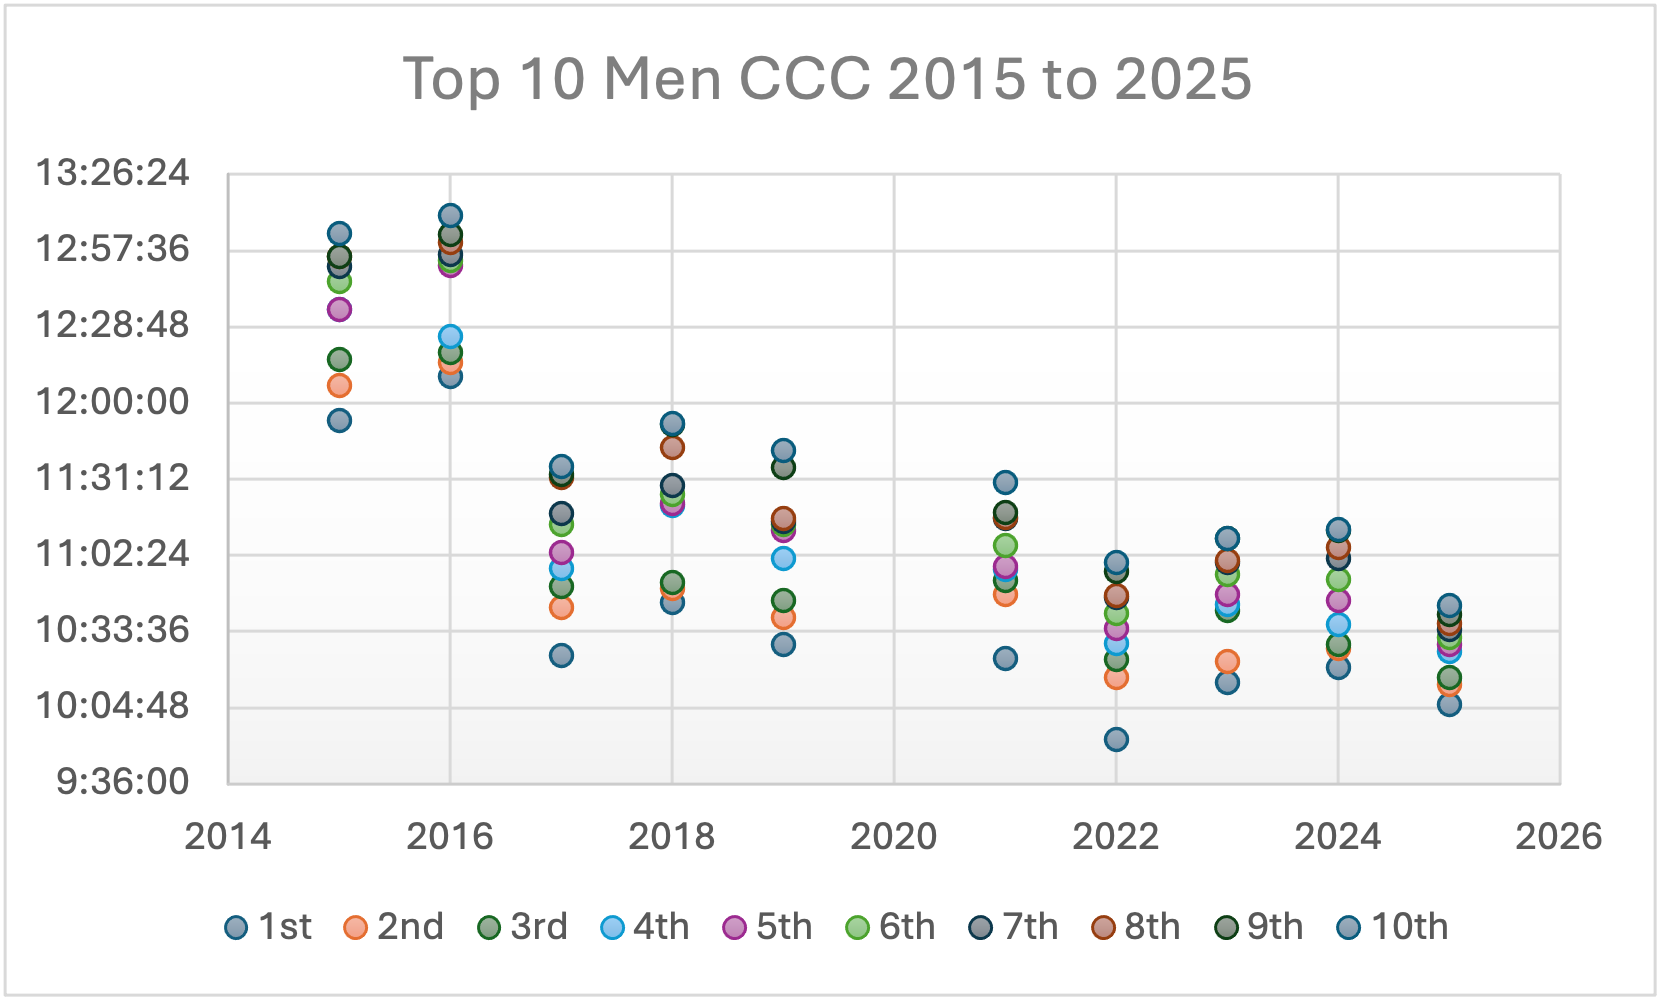
With the same caveats linked to course changes and year on year comparison, it is clear that the top 10 CCC finishers are generally getting faster, and the past four years have seen the closest racing.
Additionally, across OCC, CCC and UTMB, CCC 2025 was the closest of all the female races, and one of the few occasions that the women’s race was closer than the men’s (as a percentage of 5th place vs the winner’s time). Anyone who watched the live stream of CCC will have witnessed a truly epic race into Chamonix, with the thrilling chase between Martyna Mlynarczyk and Sylvia Nordskar all the way down from La Flégère and into town.
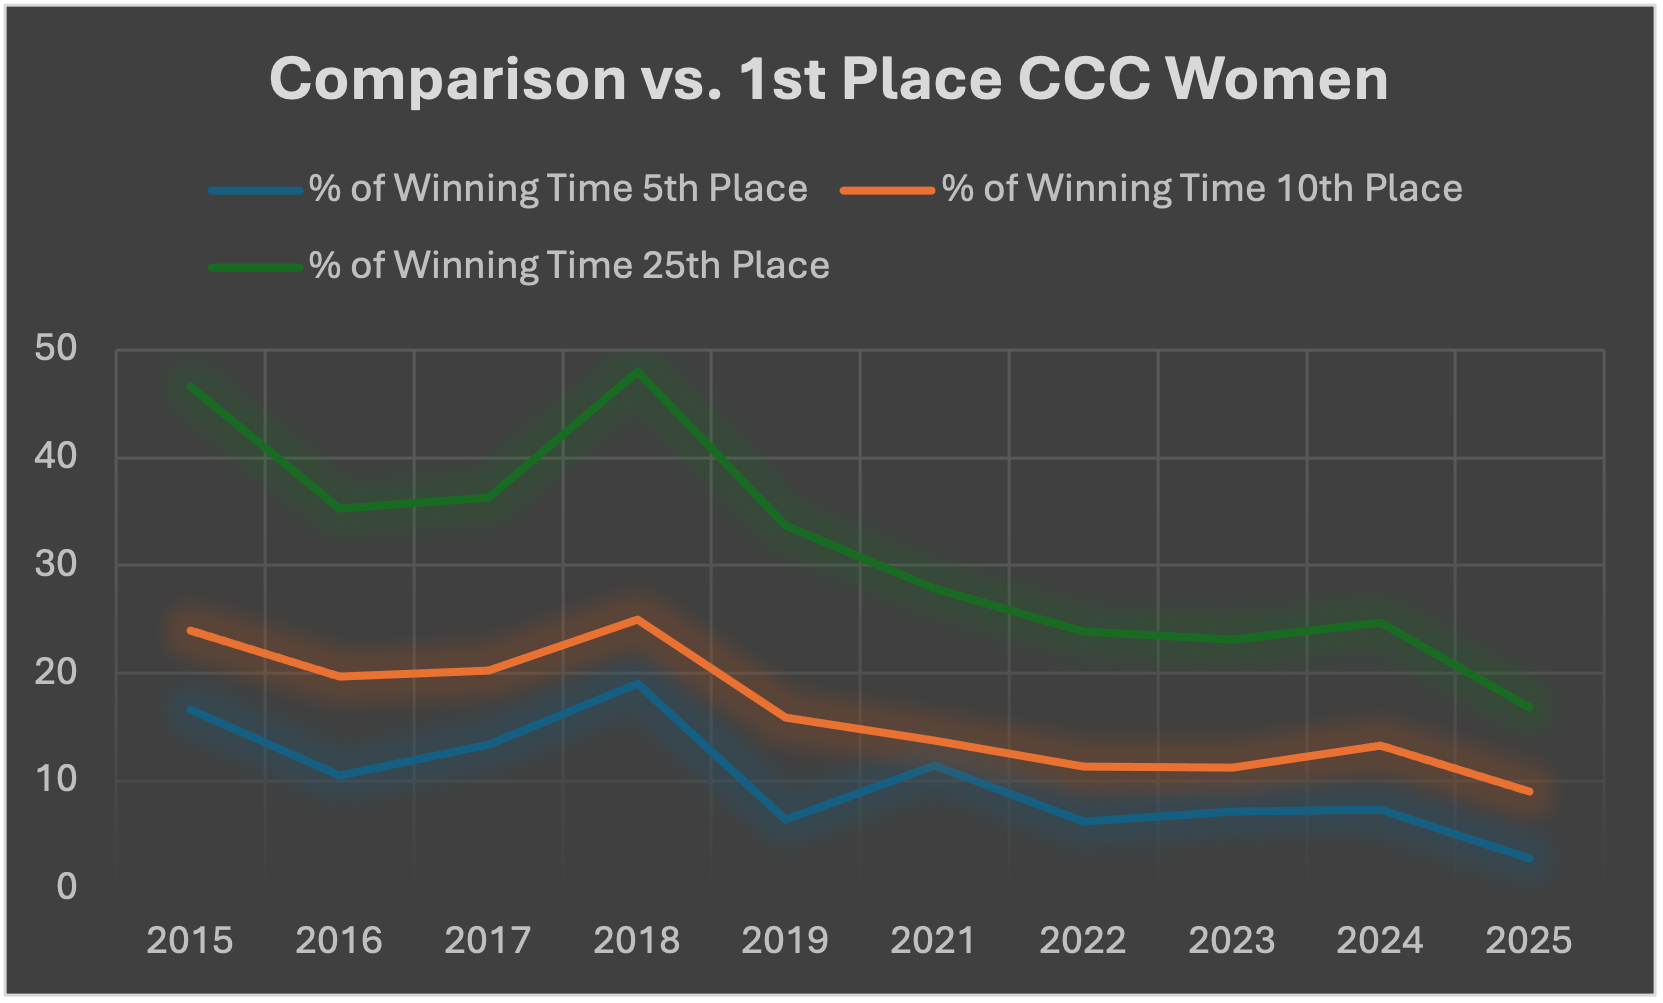
There is a very clear trend for Top 5, Top 10 and Top 25 competitors in the 100km category of the athletes finishing closer to the winner, will we see it get even closer in 2026?
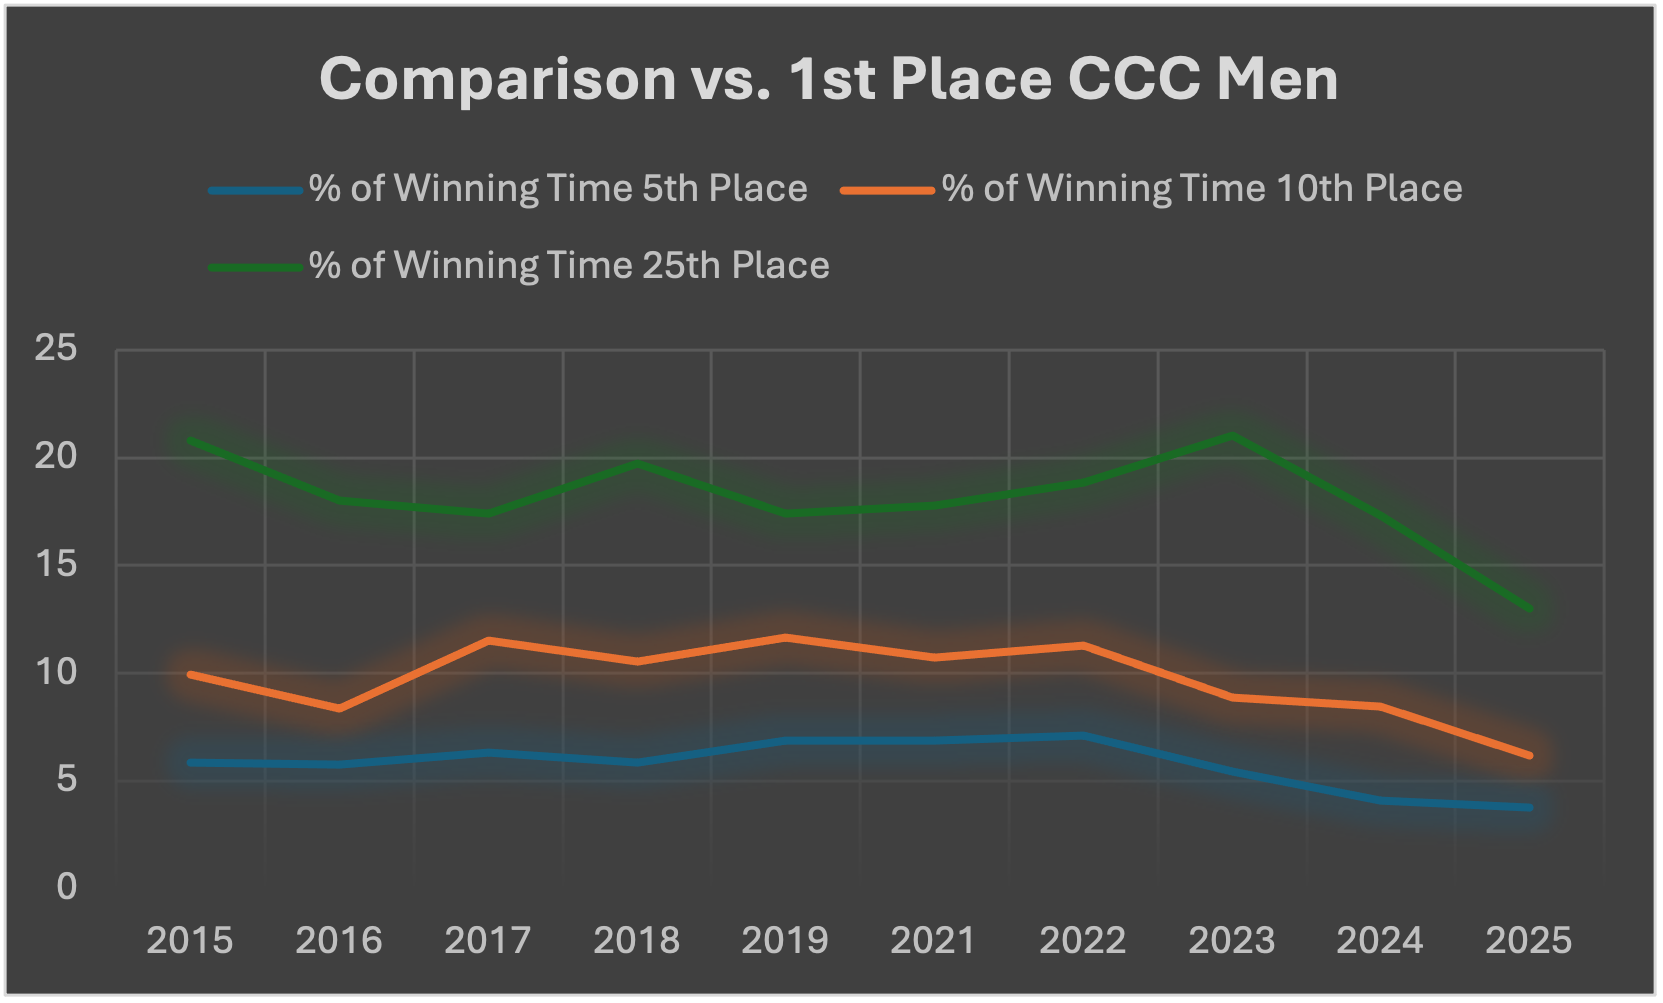
This trend is also reflected in the men’s race. 2022, 2023, 2024 and 2025 were all faster than the previous editions studied, with 2025 being the closest Top 10. In addition, it was the tightest finish (as a percentage of the winner’s time) of both the Top 5 and the Top 25.
Train for CCC with a dedicated TrainingPeaks training plan written by Performance Director Doug, featuring race advice & top tips from athletes’ experience:
For the sport of trail running, this is excellent to see as it generates exciting racing that make lives streams more interesting to watch, creates uncertainty as to who will win, and helps raise interest levels.
However, the 100-mile UTMB paints a little less clear picture.
UTMB Trends
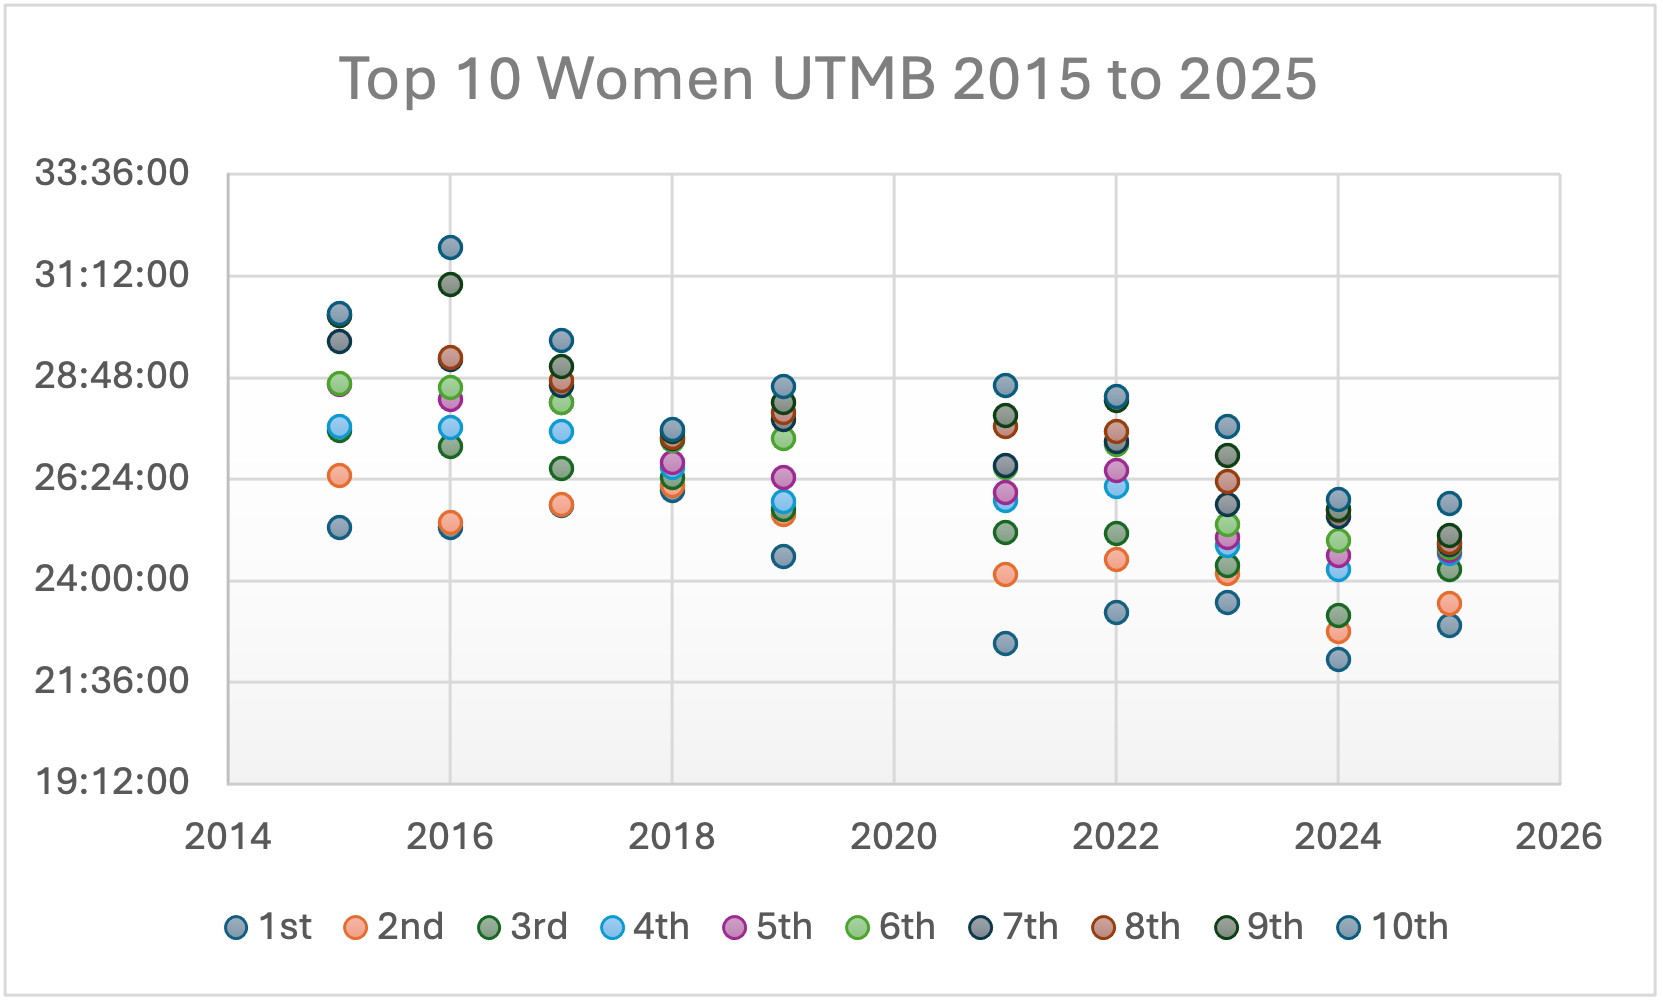
2018 is a bit of an outlier with a very tight Top 10 on the female side, while 2025 had the second tightest grouping in the women’s race. However, 2021 was very spread out, in part due to Courtney Dauwalter’s very fast finishing time.
On the male side, there is also a general downward trend in finishing times.
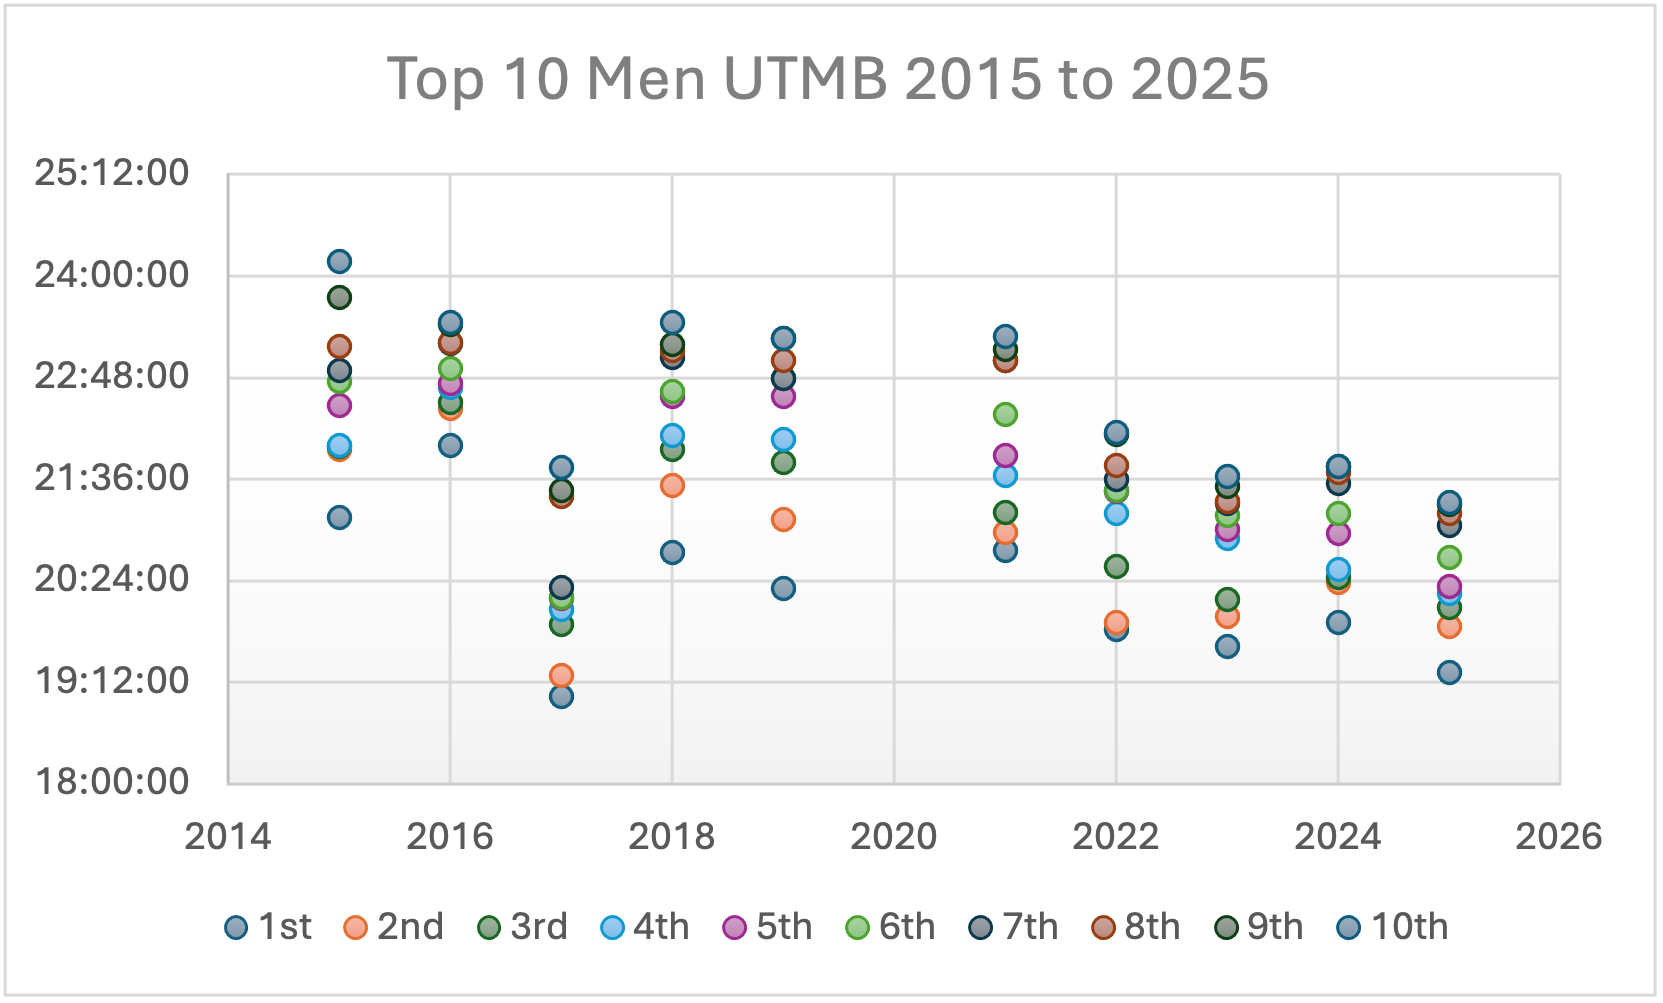
Additionally, in the past 3 years, the top 10 men have typically finished closer together than in the past editions (2016 being the exception), suggesting a greater depth in competition.
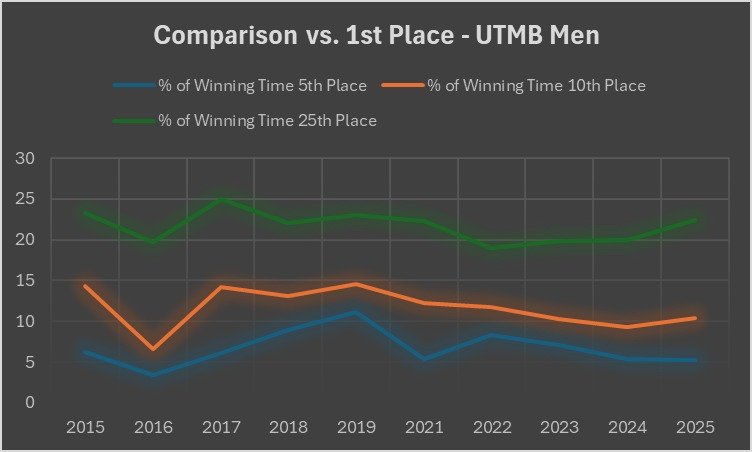
When comparing the top 5, top 10 and top 25 finishers as a percentage of the winner’s time (for the respective years) we can see some interesting patterns emerging.
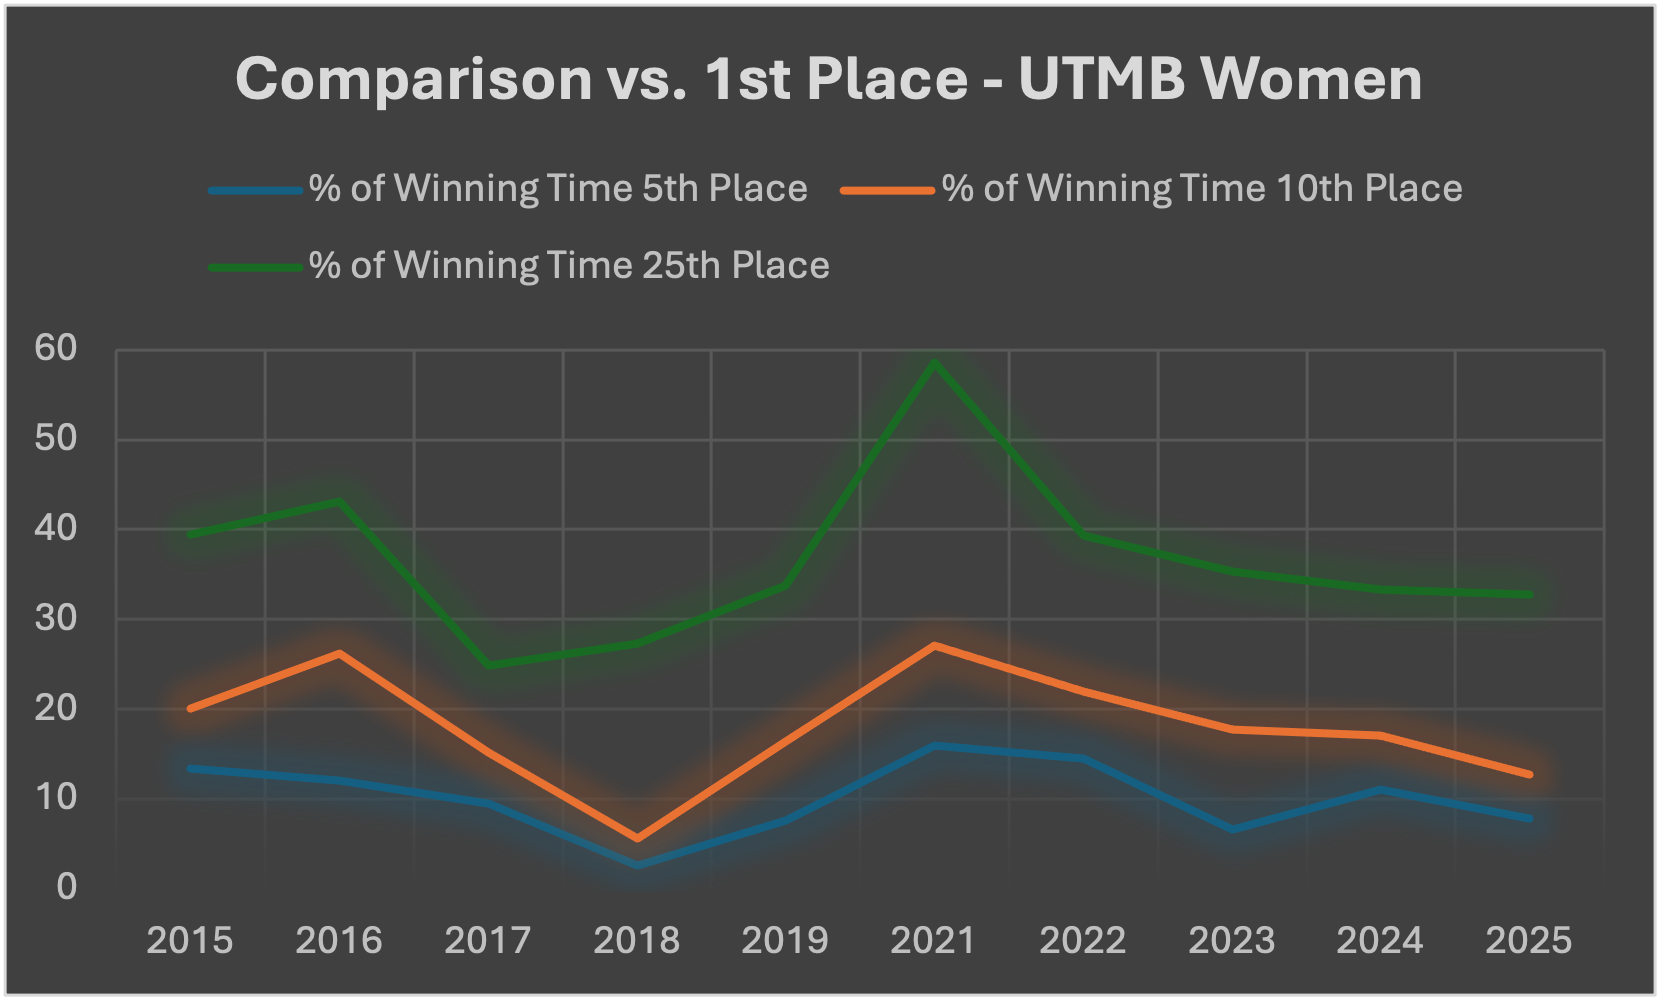
The trend for women’s times as a percentage of 1st place varies greatly, with 2017 and 2018 being very tight, and 2021 having a wider spread. However, since 2021, there has been a general closing of the gap for the Top 5, Top 10 and Top 25.
With the men, the pattern is more mixed, with the Top 25 becoming more spread out over the past four editions of the race.
Is the UTMB your goal for this year?
Performance Director Doug has written dedicated training plans for the race:
Interpreting the Trends
When looking at the trend of the 5th place finisher as a percentage of the winner’s time across all races we can see that, in general, the men’s races are closer, and that CCC and OCC have a clear closing of the Top 5, whilst the UTMB trend is a lot flatter.
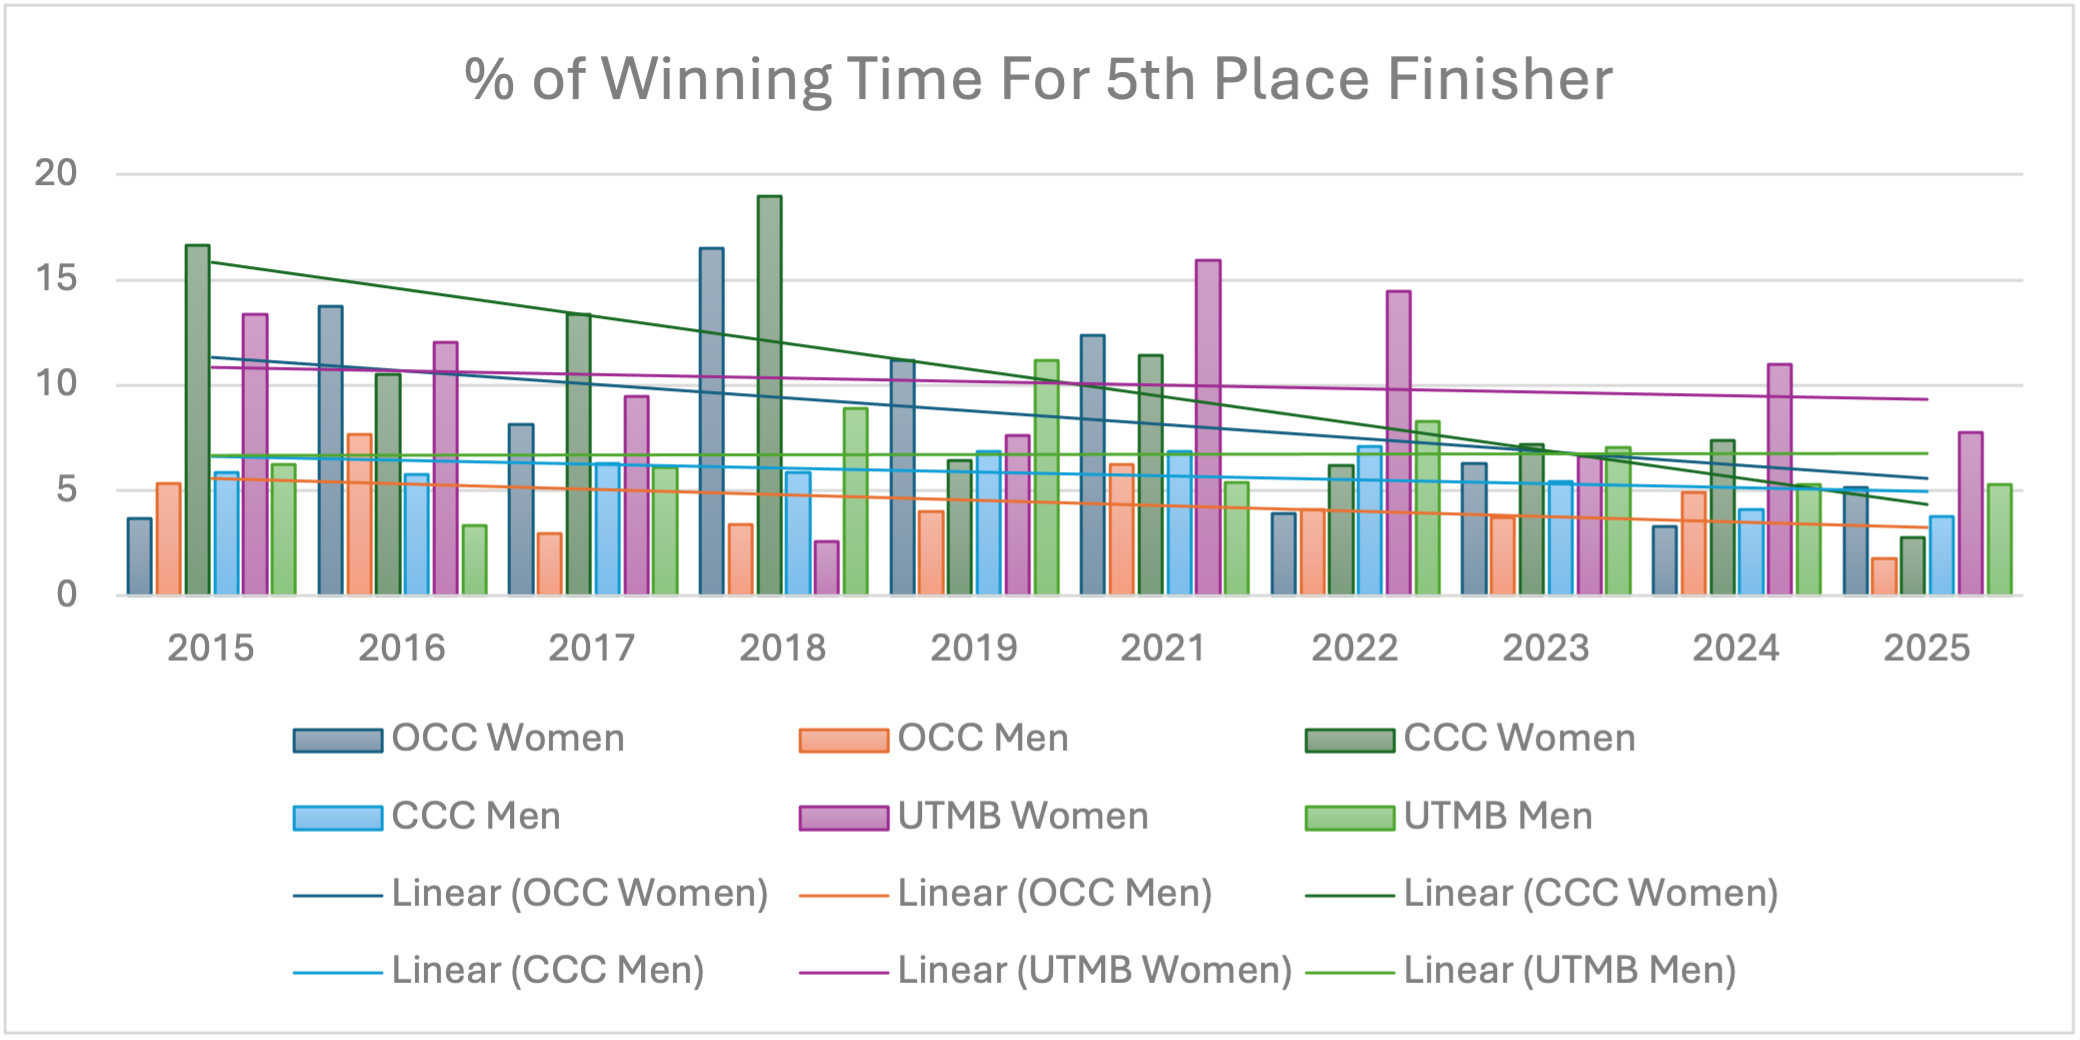
Additionally, as a general rule, we can see that, the longer the race, the more spread out the top 5 finishers are.
Looking at the Top 10, the trends are similar for OCC and CCC.
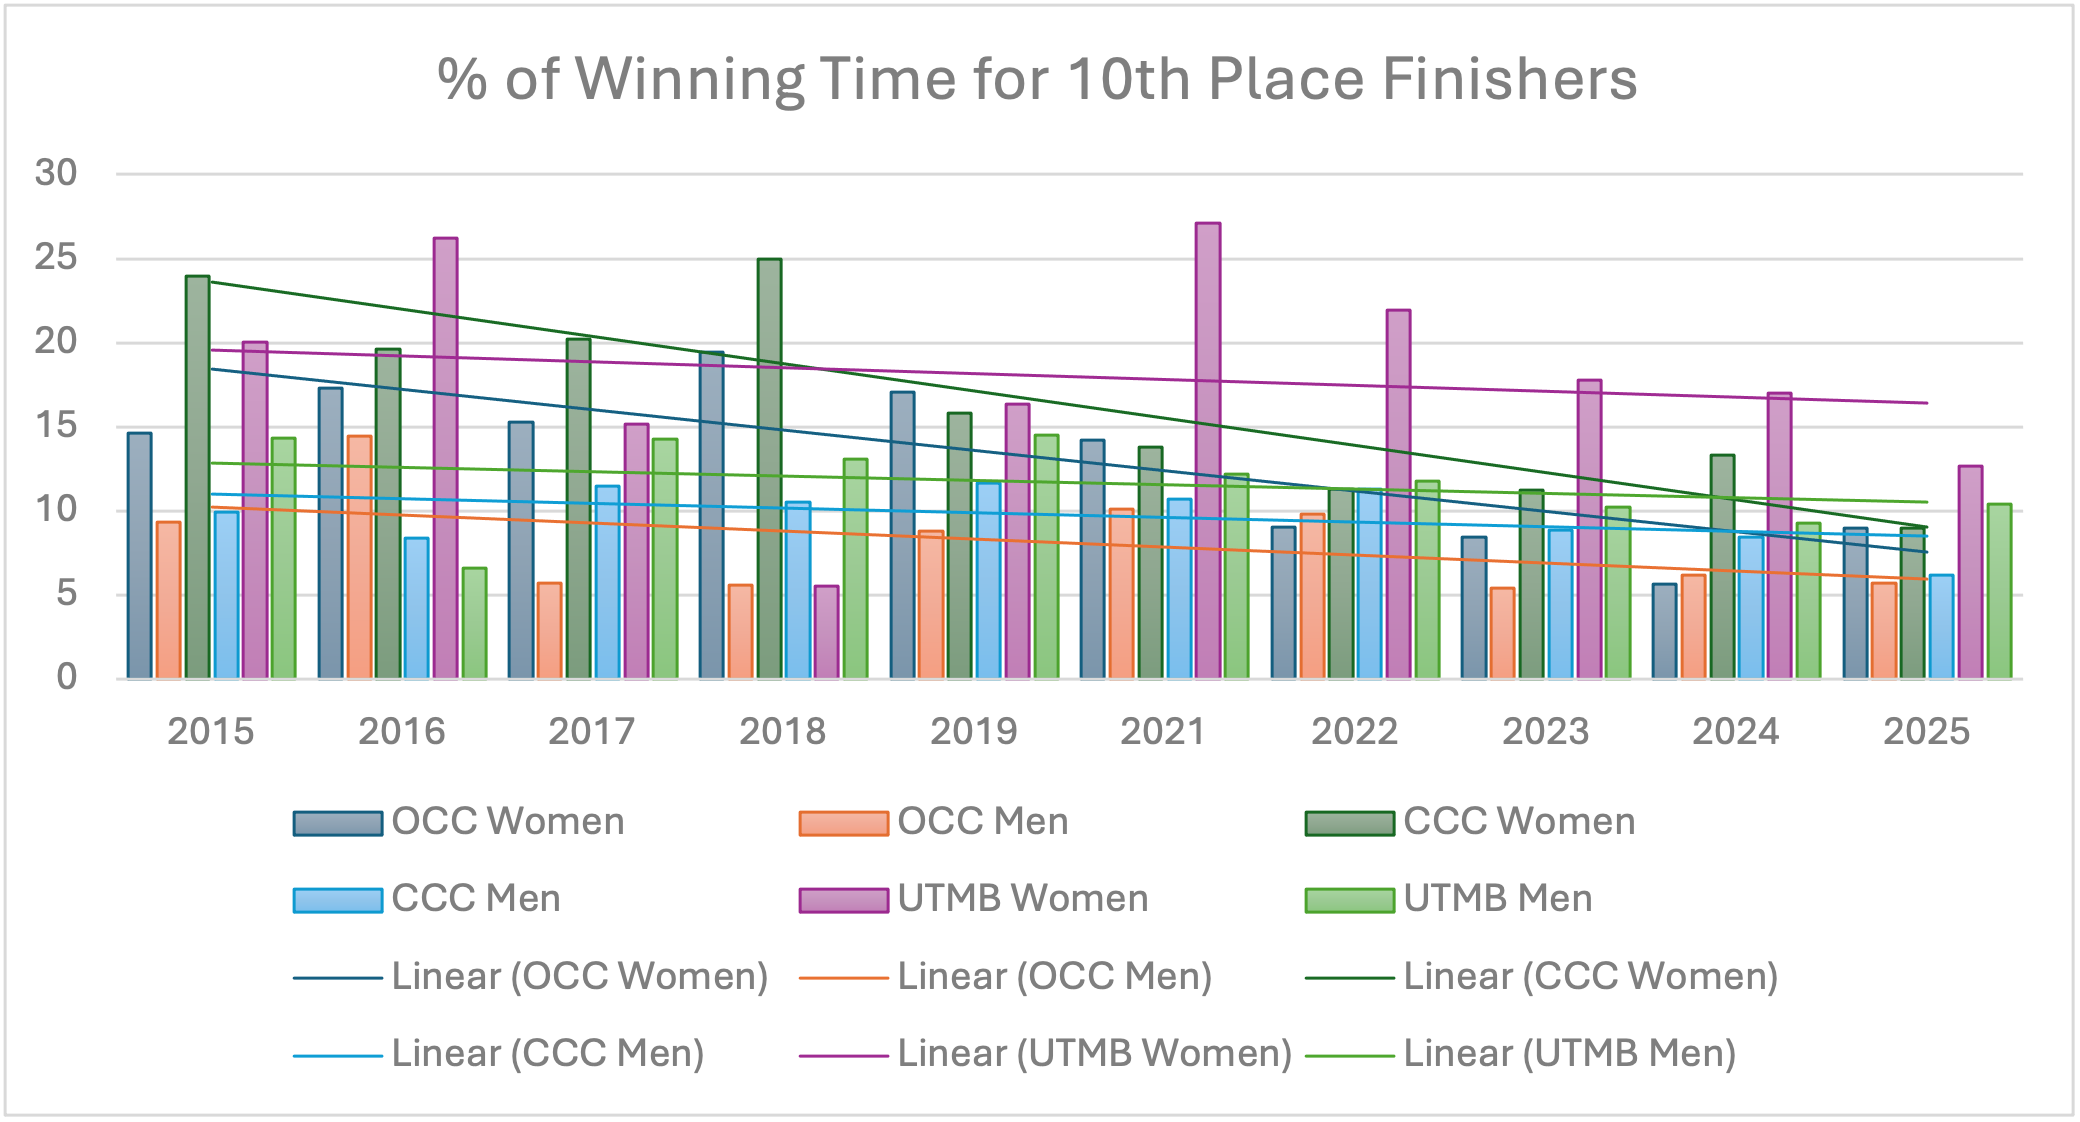
UTMB Top 10s are also trending down.
However, when looking at the Top 25, the percentage time gap to the winner on the female side does not seem to be closing.
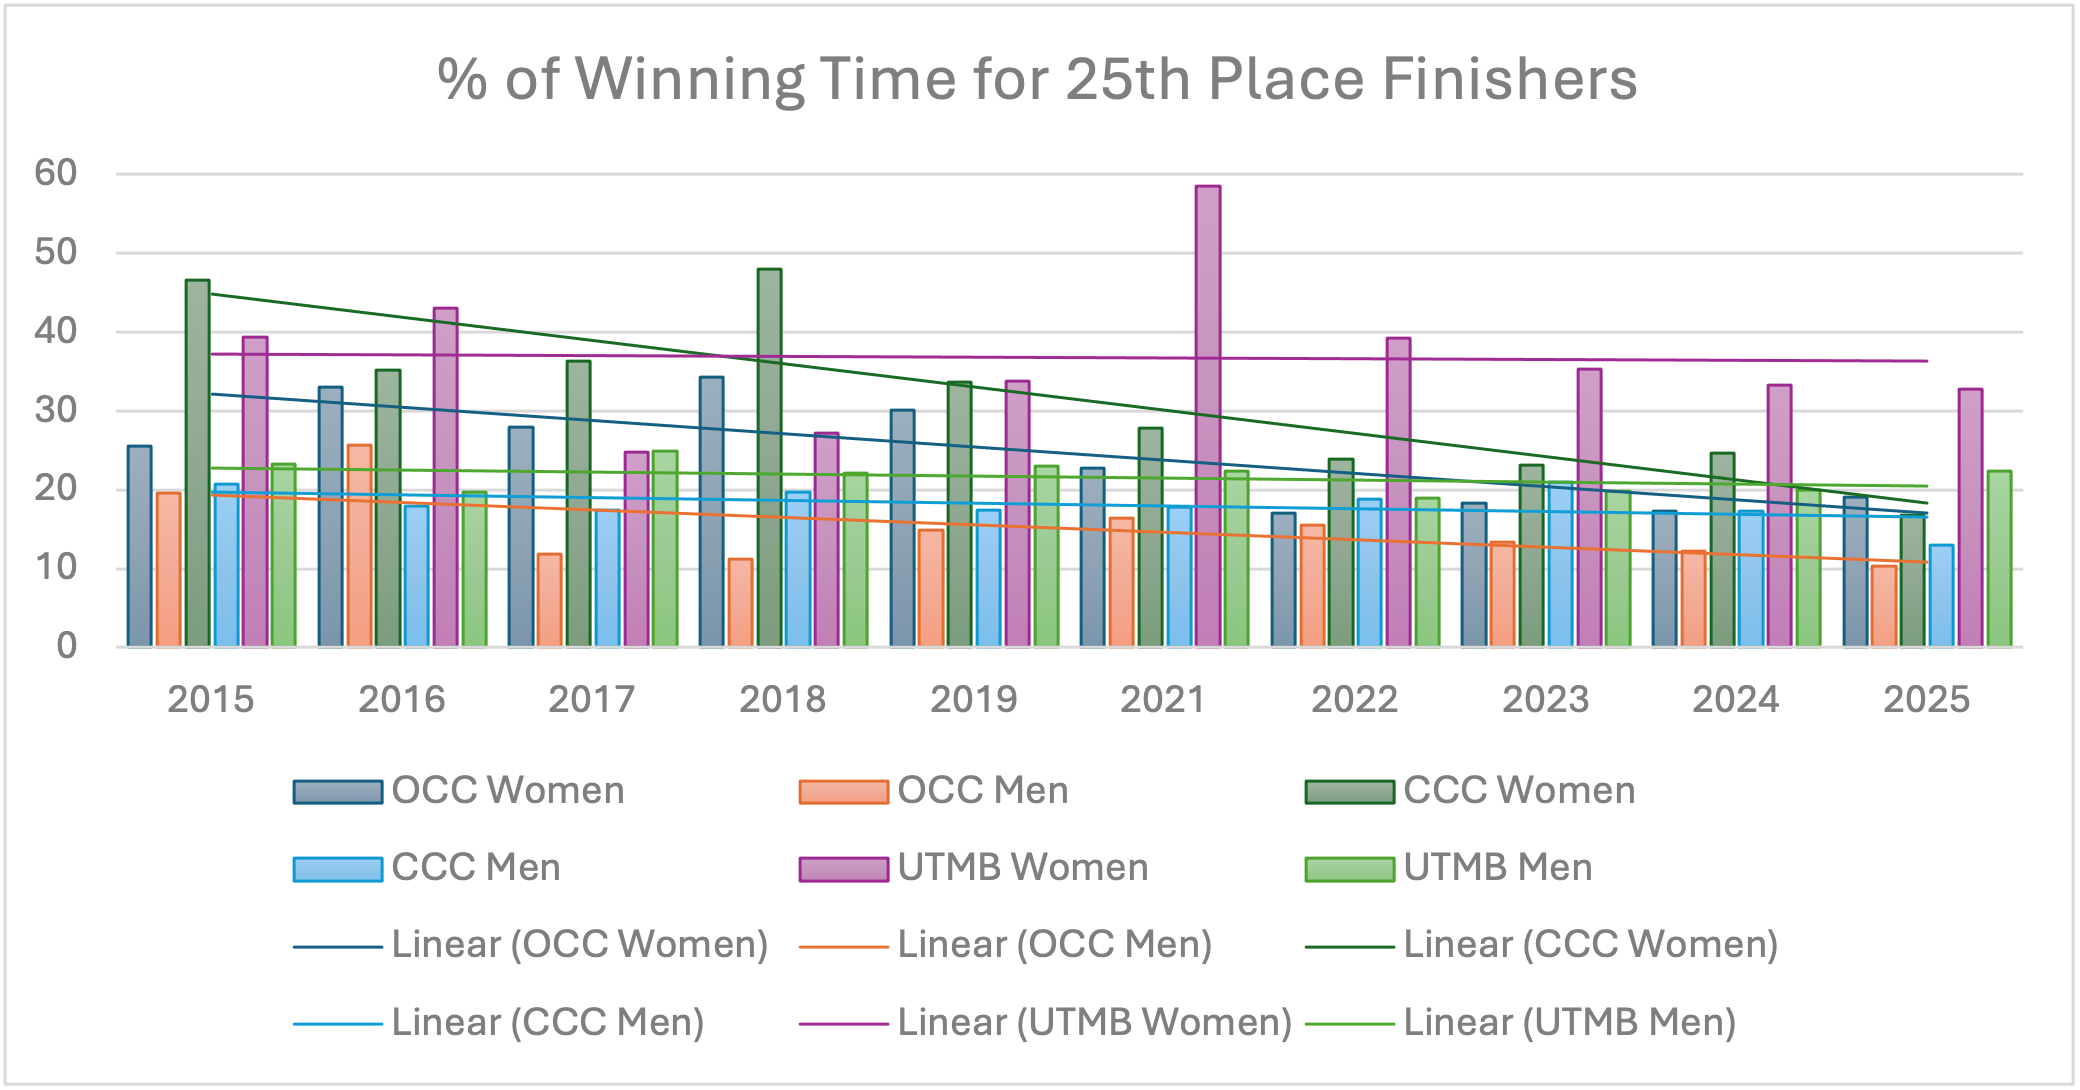
Whilst we are seeing a consistent trend down for OCC and CCC across the front of the pack, UTMB is more nuanced. The men’s trend line is dropping slowly, but the women’s trend is basically flat.
There are obviously lots of limitations with this analysis, such as isolating out 5th, 10th and 25th places only. Additionally, in the women’s race, the 2018 and 2021 outlier results will have huge implications on the trend line. If we look at only the last five years of UTMB racing, we have performances getting closer together.
Conclusion
The data suggest that all the UTMB finals are getting more competitive, a clear consequence of the growth of the sport and the qualifying criteria (with winners and/or podium results of qualifying races getting a spot for the final). The clearest evidence is at the shorter races: the OCC and CCC show a consistent tightening of the front of the field, with top 5, top 10 and even top 25 athletes finishing ever closer to the winner.
Women’s racing, albeit historically more spread out, shows a clear and exciting closing of the gaps. In some cases, the women’s races have even been tighter than the men’s when measured as a percentage of the winner’s time. This suggests a rapid rise in performance density at the front of the women’s field, reflecting improved access to professionalisation, training knowledge, and long-term athlete development.
The picture is more nuanced with the UTMB, despite a gradual improvement in the men’s race (but flatter and more variable trends in the women’s field). This is, in large part, testament to the inherently unpredictable nature of longer racing: factors like weather, pacing errors, nutrition trouble, and other elements linked to resilience all amplifying differences between athletes.
If trends continue, we can look forward to finer margins and more exciting performances – good news for the fans and for the depth and maturity of the sport.